- High efficiency and resolution
- Extremely stable in high salt solution
- Great reproducibility
- Protein separation over very low salt concentration
- High protein recovery and maintaining biological activity
- Wide pH application range 2 - 9
Separation of 4 proteins and peptide by using a 4.6×250 mm SepaxNanofilm SEC-150 column.
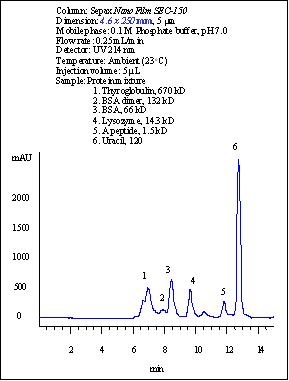
Four proteins (thyroglobulin, BSA dimer, BSA, lysozyme) and a peptide are well separated with 30,000 plates per meter for lysozyme. Even an impurity from lysozyme was very well separated. This was only seen separated with high efficiency capillary electrophoresis. (Reference: Sepax Capillary Electrophoresis Catalog). For standard test of size exclusion columns, manufacturers normally use Biorad standard proteins (thyroglobulin, IgG, ovalbumin, and myoglobin). The reason is that those proteins have pI less than 7.5, which are not positively charged at pH 7.0 separation condition. The highly positively charged proteins, such as lysozyme (pI=11.0), cytochrome C (pI= 10.6), aprotin (pI=11.0) are very difficult to elute due to the strong electrostatic interactions with the surface of the packing materials manufactured by other vendors. However, this is no longer a problem for Sepax Nanofilm SEC columns. Sepax sets its own standard of test proteins including lysozyme, a very sensitive protein for testing the quality of bioseparations.
High Efficiency Separation
For biological separations, nonspecific interactions with the packing materials are the major contribution for low separation efficiency, such as peak tailing, as well as low recovery. The unique surface chemistry of Nanofilm SEC packings generates uniform polymer chains covalently bonded on the silica. Such a uniform stationary phase is neutral and hydrophilic, which has negligible nonspecific interactions with biological molecules, especially proteins. This special coating allows Nanofilm SEC columns to achieve high selectivity and high efficiency separations. For example, uracil, as a test compound could reach as high efficiency as 90,000 plates per meter, as shown in Table below.
Table 1. Column Efficiencies (Measured using uracil in 0.1 M phosphate buffer, pH 7.0)
| Nanofilm SEC-150 | >90,000 plates/meter |
| Nanofilm SEC-250 | >90,000 plates/meter |
| Nanofilm SEC-500 | >85,000 plates/meter |
Separation of BSA dimer from BSA by using a 4.6×300 mm Nanofilm SEC-250 column.
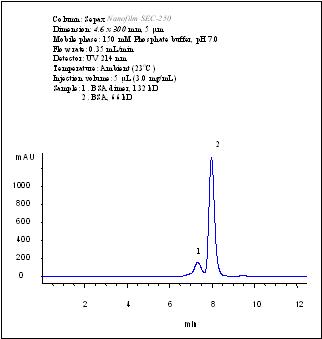 |
A Nanofilm SEC-250 column, 4.6×300 mm, achieved baseline separation of BSA dimer from BSA at 150 mM phosphate, pH 7.0.
|
Separation of the aggregates from thyroglobulin
| Conditions | |
| Columns: | Nanofilm SEC-500 (5µm,4.6×300mm) |
| Mobile phase: | 150 mM Sodium Phosphate, pH 7.0 |
| Flow rate: | 0.30 mL/min |
| Detection: | UV 214 nm |
| Injection volume: | 5 µL |
| Samples: | 1) Thyroglobulin aggregates
2) Thyroglobulin (1.0 mg/mL), 670 kD |
|
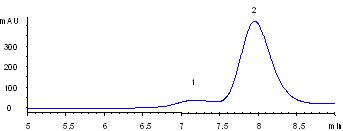 |
Thyroglobulin is a huge protein (MW 670,000). The commercial sample of thyroglobulin contains the aggregate impurity, possibly dimer or tetramer. Sepax Nanofilm SEC-500 provides a baseline separation of the aggregates from thyroglobulin.
The Impact of Pore Structure on Separation
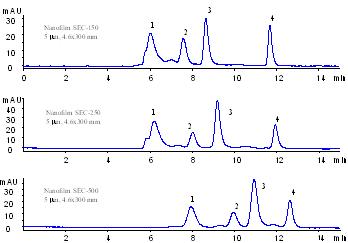
The pore size of the SEC packings plays a critical role on protein separations. The selection of a Nanofilm SEC phase for a particular molecular weight range protein sample is based on the exclusion limit and linear molecular weight range of the Nanofilm packings that are shown below.
| Nanofilm Packings | Protein MW exclusion limit |
|---|
| Nanofilm SEC-150 | 750,000 |
| Nanofilm SEC-250 | 1,250,000 |
| Nanofilm SEC-500 | 2,500,000 |
Comparison of the separation patterns by Nanofilm SEC-150, Nanofilm SEC-250 and Nanofilm SEC-500.
 |
| Conditions | |
| Mobile phase: | 150 mM Sodium Phosphate, pH 7.0 |
| Temperature: | Ambient (~23 °C) |
| Flow rate: | 0.35 mL/min |
| Detection: | UV 280 nm |
| Injection volume: | 5 µL |
| Samples: | 1. Thyroglobulin (1.0 mg/mL), 670 kD
2. BSA (1.0 mg/mL), 66 kD
3. Ribonuclease A (1.0 mg/mL), 13.7 kD
4. Uracil (2.5 mg/mL), 120 |
|
High Protein Recovery and Maintaining Activity
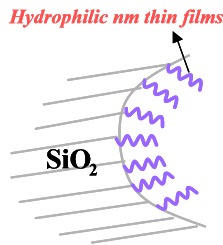
The Nanofilm SEC phases are composed of a hydrophilic and neutral polymer thin film with certain thickness that is chemically bonded on the silica surface. Proteins and other biological molecules have negligible nonspecific interactions with such stationary phases. The protein adsorption to the silica is suppressed, leading to high recovery and maintaining the activity after separations. Table below shows the recovery results of BSA and lysozyme, the representatives for acidic and basic proteins, separately.
| Column | Protein Recovery% |
|---|
| Nanofilm SEC-150 | BSA | >95% |
| Lysozyme | >90% |
| Nanofilm SEC-250 | BSA | >95% |
| Lysozyme | >90% |
| Nanofilm SEC-500 | BSA | >95% |
| Lysozyme | >95% |
|
Recovery of proteins from the Nanofilm SEC columns (measured with a 4.6×250 mm column in 0.15 M phosphate buffer, pH 7.0)
|
High Stability of Sepax Nanofilm SEC Phases
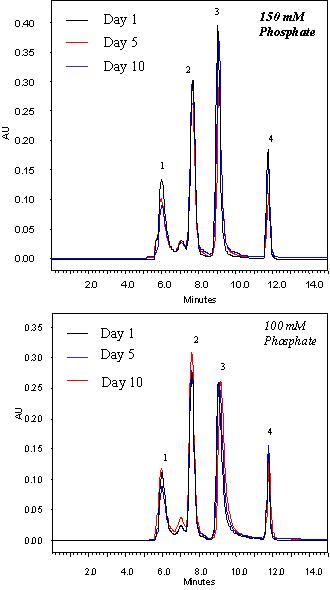
The Nanofilm SEC columns uses full coverage bonded silica packing. The polymeric thin film is densely packed on the silica surface which greatly hinders the diffusion of the attacking molecules to the silica-polymer bonding, thus enabling exceptional high stability. The Nanofilm SEC phases are compatible with most aqueous buffers, such as ammonium acetate, phosphate, trizma and so on. When 150 mM phosphate buffer at pH 7.0 was used as the mobile phase to run the Nanofilm SEC columns, 1,000 injections or 3 months of usage made negligible deterioration for its performance. After 3 months of running in 150 mM phosphate buffer at pH 7.0, the average retention time change was within 5%.
 |
| Conditions | |
| Column: | Nanofilm SEC-150 (5µm, 4.6×300mm) |
| Mobile phase: | 150 mM phosphate buffer, pH 7.0 |
| Flow rate: | 0.35 mL/min
Running for 10 h/day |
| Temperature: | Ambient |
| Detector: | UV 214 nm |
| Injection volume: | 5 µL |
| Sample: | 1. Thyroglobulin (1.0 mg/mL)
2. BSA (1.0 mg/mL)
3. Lysozyme (1.0 mg/mL)
4. Uracil (0.1 mg/mL) |
|
Figure above shows the separation profiles of a Nanofilm SEC-150 at the day 1, 5, and 10 with 10 hours/day running at the flow rate of 0.35 mL/min in 150 mM and 100 mM phosphate buffer, respectively. The separations are almost identical.
| Retention time variations of three proteins and uracil within 500 column volume injections. The test conditions are the same as those in Figure above. |
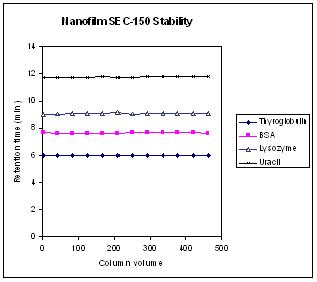 |
Figure above is the stability test for retention time of proteins and a small molecule over 500 column volume running in two weeks. It shows negligible retention time change for each of those three proteins as well as uracil within 500 column volume testing.
The Nanofilm SEC phases can tolerate very high concentration of salts, such as 1.0 M. The Nanofilm SEC columns are very stable in both organic solvents, such as methanol, ethanol, THF, DMF, DMSO, and so on, and the mixture of water and organic solvents.
The Nanofilm SEC columns have very good stability over a wide range of pH from 2 to 8.5. In addition, they can even tolerate very higher pH, such as pH 8.5-10 for temporary using.
The tolerance of temperature for the Nanofilm SEC phases is also excellent. The working temperature can go as high as 80 °C.
Reproducibility of the Nanofilm SEC columns
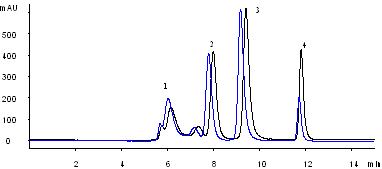
The controlled surface chemistry for synthesizing the Nanofilm SEC phases makes the surface coating very reproducible, leading to very consistent columns. The separation variation from batch to batch is within 5% for the retention time. Figure below is the separation of the Sepax standard protein mixture by the Nanofilm SEC-250 columns from two different lots. The largest variation is the retention time for lysozyme, which is ca. 2%.
Comparison of the separations by two different batches of Nanofilm SEC-250 (5 µm), 4.6×300 mm columns.
| Conditions | |
| Mobile phase: | 150 mM phosphate buffer, pH 7.0 |
| Flow rate: | 0.35 mL/min |
| Temperature: | Ambient |
| Injection volume: | 5 µL |
| Sample: | 1. Thyroglobulin (1.0 mg/mL)
2. BSA (1.0 mg/mL)
3. Lysozyme (1.0 mg/mL)
4. Uracil (0.1 mg/mL) |
MW Calibration for Protein Separation
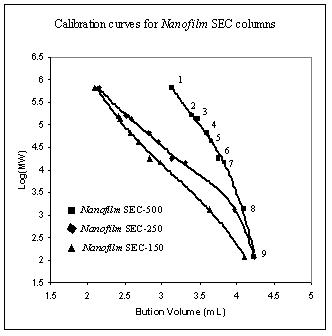
For size exclusion chromatography, individual pore size packings determine the range of molecular weight for separation, while the pore volume controls the separation capacity. Sepax's three pore size packings cover whole range of biological molecules. The protein calibration curves for Nanofilm SEC-150, Nanofilm SEC-250, and Nanofilm SEC-500 are shown below.
Protein MW calibration with Nanofilm SEC-150, Nanofilm SEC-250, and Nanofilm SEC-500 phases.
 |
| Conditions | |
| Column: | 5 µm, 4.6×300mm |
| Mobile phase: | 150 mM phosphate buffer, pH 7.0 |
| Flow rate: | 0.35 mL/min |
| Temperature: | Ambient |
| Detector: | UV 214 nm |
| Injection volume: | 5 µL |
| Sample: | 1. Thyroglobulin (670 kD)
2. IgG (150 kD)
3. BSA dimer (132 kD)
4. BSA (66 kD)
5. Ovalbumin (44 kD)
6. Myoglobin (17.6 kD)
7. Lysozyme (14.3 kD)
8. B12 (1.35 kD)
9. Uracil (120) |
|
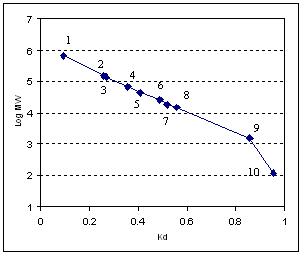
Another widely used method to characterize the SEC phases is the calibration curve between protein MW and the distribution coefficient (Kd). Kd value is defined by the equation below:
Kd = (Ve-Vo)/(VT-Vo)
Where Ve, VT, and Vo are the sample elution volume, the column total liquid volume, and the column void volume, respectively. The linear region between the protein MW and Kd is frequently used as the reference for the selection of the SEC phases. As plotted in Figure below, the Nanofilm SEC-150 phase has an excellent linear relationship between protein MW and Kd in a wide range of MW.
Protein MW calibration curve for Nanofilm SEC-150.
| Conditions | |
| Column: | Nanofilm SEC-150 (5 µm, 4.6×300mm) |
| Mobile phase: | 100 mM phosphate buffer, pH 7.0 |
| Flow rate: | 0.35 mL/min |
| Temperature: | Ambient |
| Detector: | UV 214 nm |
| Injection volume: | 5 µL |
| Sample: | 1. Thyroglobulin (670 kD)
2. IgG (150 kD)
3. BSA dimer (132 kD)
4. BSA (66 kD)
5. Ovalbumin (44 kD)
6. Alpha-chymotrypsin (25 kD)
7. Myoglobin (17.6 kD)
8. Lysozyme (14.3 kD)
9. A peptide (1.5 kD)
10. Uracil (120) |
|
 |
Proteins Separations at very low salt concentration
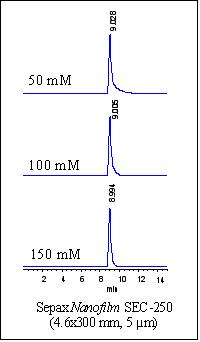
In separation of positively charged proteins, a high concentration of salt is needed to shield the strong electrostatic interaction between the silica packing and the proteins. For example, cytochrome C, a highly positively charged protein (pI=9.6) is very difficult to be eluted at a low salt concentration, such as 50 mM phosphate buffer at pH 7.0. The need for high concentration salt to elute proteins greatly limits the applications. Sepax designed a special Nanofilm SEC phase that could well elute positively charged proteins. As shown in Figure below, a specially designed Nanofilm SEC-500 eluted cytochrome C at 50 mM, phosphate buffer at pH 7.0, which could not be done with any other silica based SEC phases. Such specially designed Nanofilm SEC phases can expand size exclusion chromatography to a variety of new applications, such as separation of salt sensitive biological molecules, protein binding studies, and LC/MS detections.
Cytochrome C elution profile with phosphate buffer at pH 7.0.
 |
| Conditions | |
| Column: | Nanofilm SEC-250 (5 µm, 4.6×300mm) |
| Mobile phase: | 150 mM phosphate buffer, pH 7.0 |
| Flow rate: | 0.35 mL/min |
| Temperature: | Ambient |
| Detector: | UV 214 nm |
| Injection volume: | 5 µL |
| Sample: | Cytochrome C (1.0 mg/mL) |
|


 Four proteins (thyroglobulin, BSA dimer, BSA, lysozyme) and a peptide are well separated with 30,000 plates per meter for lysozyme. Even an impurity from lysozyme was very well separated. This was only seen separated with high efficiency capillary electrophoresis. (Reference: Sepax Capillary Electrophoresis Catalog). For standard test of size exclusion columns, manufacturers normally use Biorad standard proteins (thyroglobulin, IgG, ovalbumin, and myoglobin). The reason is that those proteins have pI less than 7.5, which are not positively charged at pH 7.0 separation condition. The highly positively charged proteins, such as lysozyme (pI=11.0), cytochrome C (pI= 10.6), aprotin (pI=11.0) are very difficult to elute due to the strong electrostatic interactions with the surface of the packing materials manufactured by other vendors. However, this is no longer a problem for Sepax Nanofilm SEC columns. Sepax sets its own standard of test proteins including lysozyme, a very sensitive protein for testing the quality of bioseparations.


